
Prof Zdobnov Laboratory
Bioinformatics is at the interface of biology and computer science. We study genome function and evolution of humans and microbiomes.
Tools
Biome & AI
We focus on metagenomics and machine learning. ✨
Genomics is a Big Data field now, and we develop tools to automate analyses.
Focusing on: Viruses/phages, bacteria AMR/virulence, Taxonomy.
Genomics
- Dipluran Campodea augens
- Damselfly Calopteryx splendens
- Ice crawler Galloisiana yuasai
- Bristletail Lepismachilis y-signata
- Firebrat Thermobia domestica
# Tools 🔨
# LEMMI
is the first-of-its-kind continuous benchmarking platform for metagenomics classifiers, featuring multi-objective ranking, and effective distribution of containerised software. It enables:
- Users to make informed choices and to obtain standardised and easy-to-use tools, and
- Method developers to showcase novel approaches and to get trusted benchmarks for publications.
# BUSCO
assesses the "expected" gene content. BUSCO can be used for
- quality control of genomics data sets,
- applications in comparative genomics,
- gene predictor training, and
- phylogenomics.
User guide >> (opens new window)
Go to BUSCO >>
# OrthoDB
is a database of "equivalent" genes across species. Pioneering hierarchical orthology, OrthoDB provides:
- the broadest coverage from animals to microbes and viruses
- evolutionary and functional annotations of orthologs
..more >>
Go to OrthoDB >>
Get Orthologer >>
# miRmap
ranks potential miRNA targets with thermodynamic, evolutionary, probabilistic, and sequence-based feature predictors. It is available as a webserver and a Python software library.
# Newick Utils (opens new window)
for processing phylogenetic trees: re-rooting, trimming, pruning, condensing, drawing (ASCII graphics or SVG).
# ezVIR (opens new window)
Human virus screening from high-throughput sequencing data
..2014 Paper >> (opens new window)
..apparently, it is still one of the top performers around >> (opens new window)
# ATLAS (opens new window)
A collaborative project to create a Snakemake workflow for assembly, annotation, and genomic binning of metagenomic sequence data.
# Phigaro (opens new window)
A collaborative project for prophage annotation.
# CEGA (opens new window)
# immunoDB (opens new window)
# MicroBiome / AI ✨
# Why metagenomics? - an open approach.
..Slides >> (opens new window)
# Viromics of clinical samples
was a subject of our productive collaboration (opens new window) with the HUG virology lab.
# Epstein-Barr virus sequence diversity in chronically infected patients & G2GWAS.
..soon
# ACI-1 beta-lactamase (AMR gene) (opens new window)
is widespread across human gut microbiomes in Negativicutes due to transposons harboured by tailed prophages.
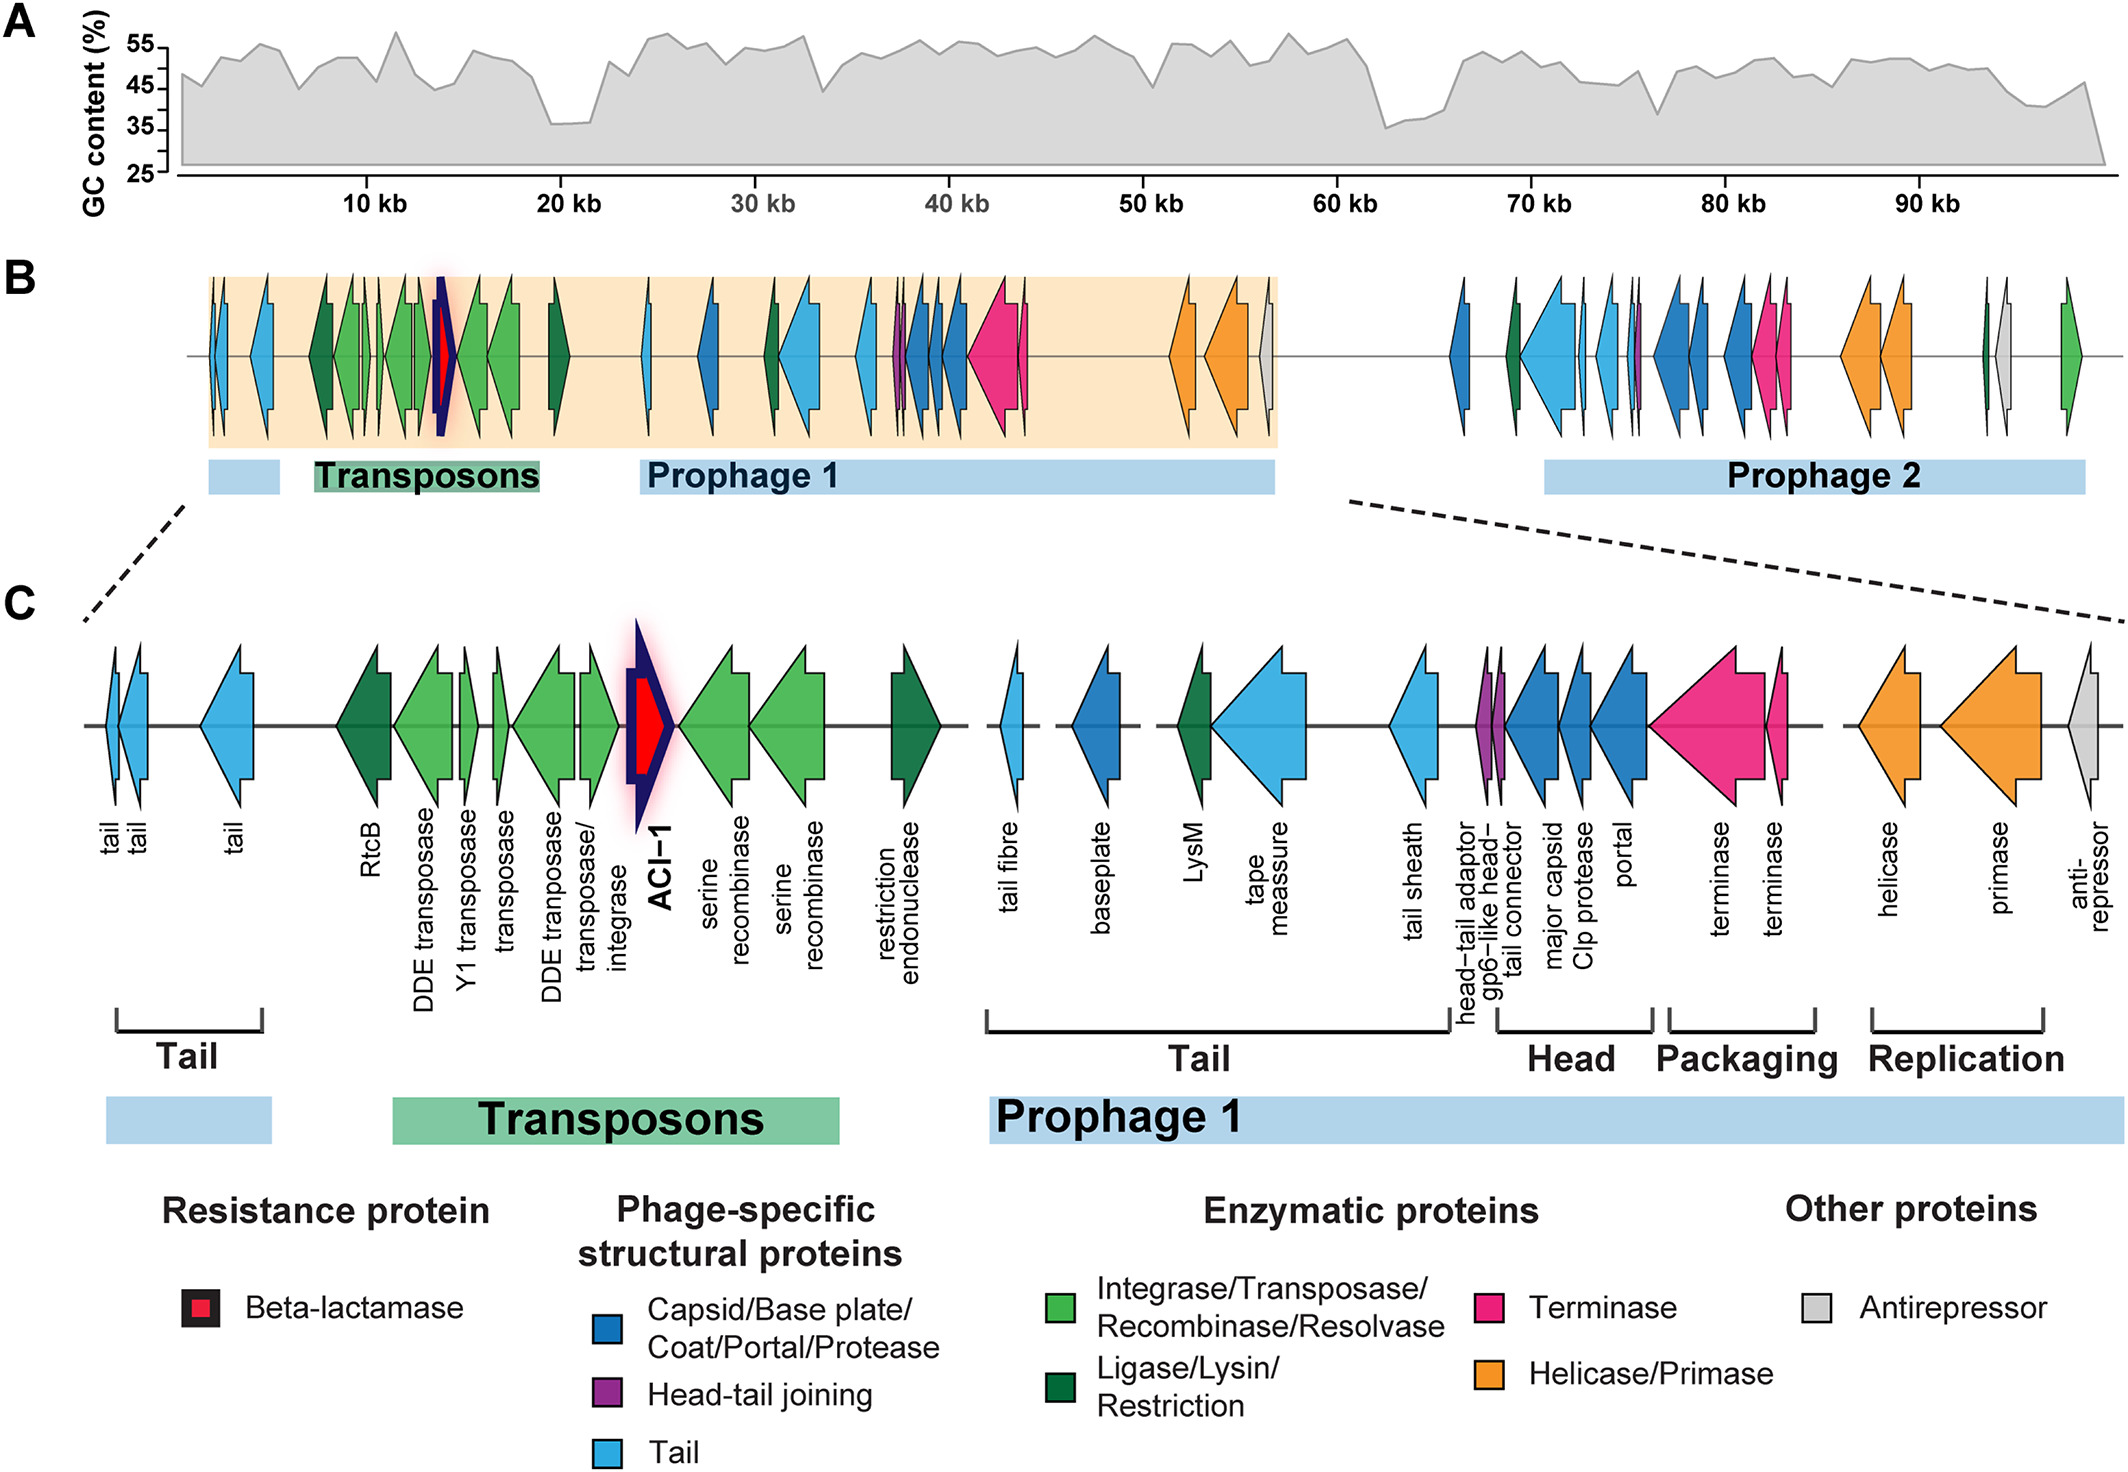
# Negativicutes bacteria (opens new window)
are gram‐negative having two cell membranes, though radiated from gram‐positive Firmicutes having only a single membrane; and phages adapted accordingly.

# Why Machine Learning? - the way forward.
..Slides >> (opens new window)
# Genomics / Sequencing 🐜
# Comparative genomics
was part of many animal and arthropod sequencing projects, and we have contributed some of these.
We have also sequenced a few ourselves:
# Dipluran Campodea augens

is a blind soil-dwelling and ancestrally wingless hexapod
..Published in GBE >> (opens new window) ..Supplementary data >> (opens new window)
With Diplura as sister clade to Insecta, the C. augens genome represents a key out-group reference for studying the emergence of genomic innovations in insects. It is blind but displays light-avoidance behaviour, and it has the ability to regenerate lost body appendages.
- we uncovered a massive expansion of the chemosensory gene family of ionotropic receptors (IRs). This is by far the largest IR family known in the animal kingdom so far. This enormous expansion likely reflects adaptation to soil life and it might compensate for the loss of vision.
# Damselfly Calopteryx splendens

belongs to the early radiated winged insect clade of Palaeoptera
Odonate species have been extensively used for studying insect behaviour, ecology and evolution. Our genomic data will propel such studies to the molecular level, as it will be the first publication describing a genome of an Odonata representative. No less importantly, our data will bring us closer to studying the evolution of early insect traits such as the emergence of wings and metamorphosis.
We have found
- a detoxification gene that has not been found in the genome of any other insect,
- a unique gene architecture in the peptidoglycan recognition protein (PGRP) family of immunity-related proteins,
- a copy of the conserved odorant receptor coreceptor (Orco) gene, but no other odorant receptors (ORs).
# Drain fly Psychoda alternata

an accidental sequencing of a mostly complete transcriptome from a drain fly and a novel Rhabdovirus-like virus
..Preprint >> (opens new window)
..Slides >> (opens new window)